
Featured case study
Aires de Río / Habitat Prime
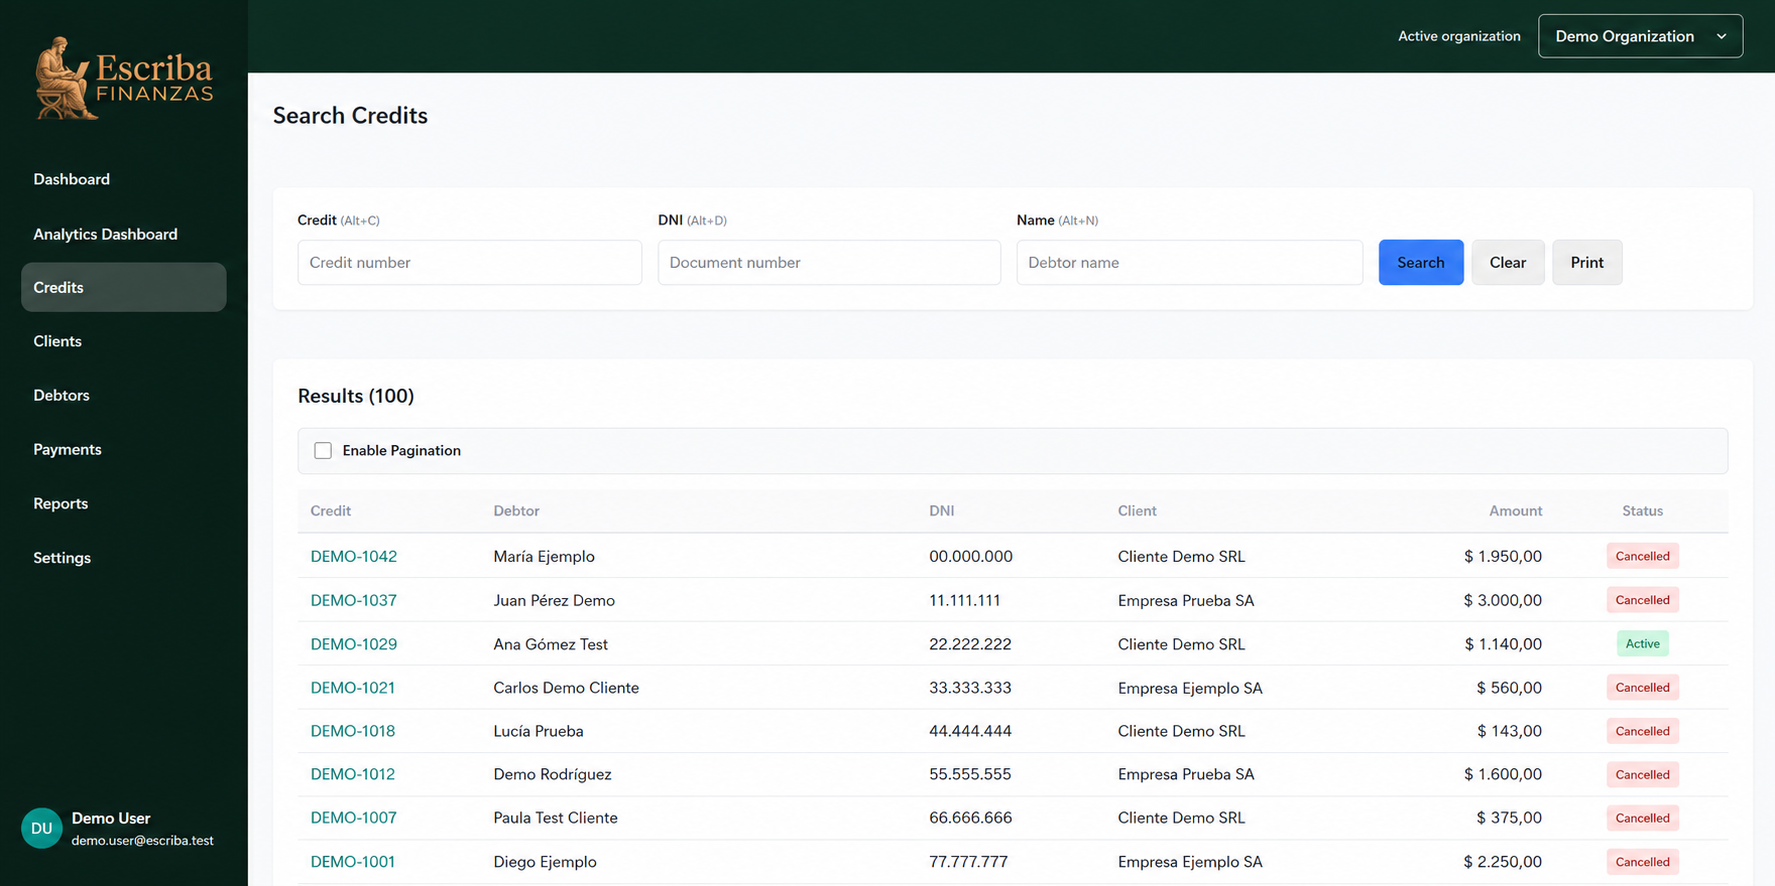
SvelteKit marketing site with map search, floor plans, gated downloads, and lead admin.
Problems clients hire Infomerx to solve
Currently accepting new engagements; replies usually within two business days.
Infomerx builds production-grade web applications, data visualization platforms, technical prototypes, and software systems where clarity, performance, and engineering depth matter.
Featured case study
SvelteKit marketing site with map search, floor plans, gated downloads, and lead admin.
~3
leads per day average
during active campaign window
~US$1
per lead during campaign
ad spend efficiency at launch
400+
daily visitors during peak
campaign traffic to the site
Live
production launch
deployed with ops and admin tooling
We focus on systems that are useful, maintainable, and built for the long run. No hype, no vaporware — just shipped work and honest context.
Case studies name delivery context (LLC, subcontract, programme, or in-house), link public references where they exist, and separate client-facing launches from pre-release products—so you can evaluate claims against something concrete.
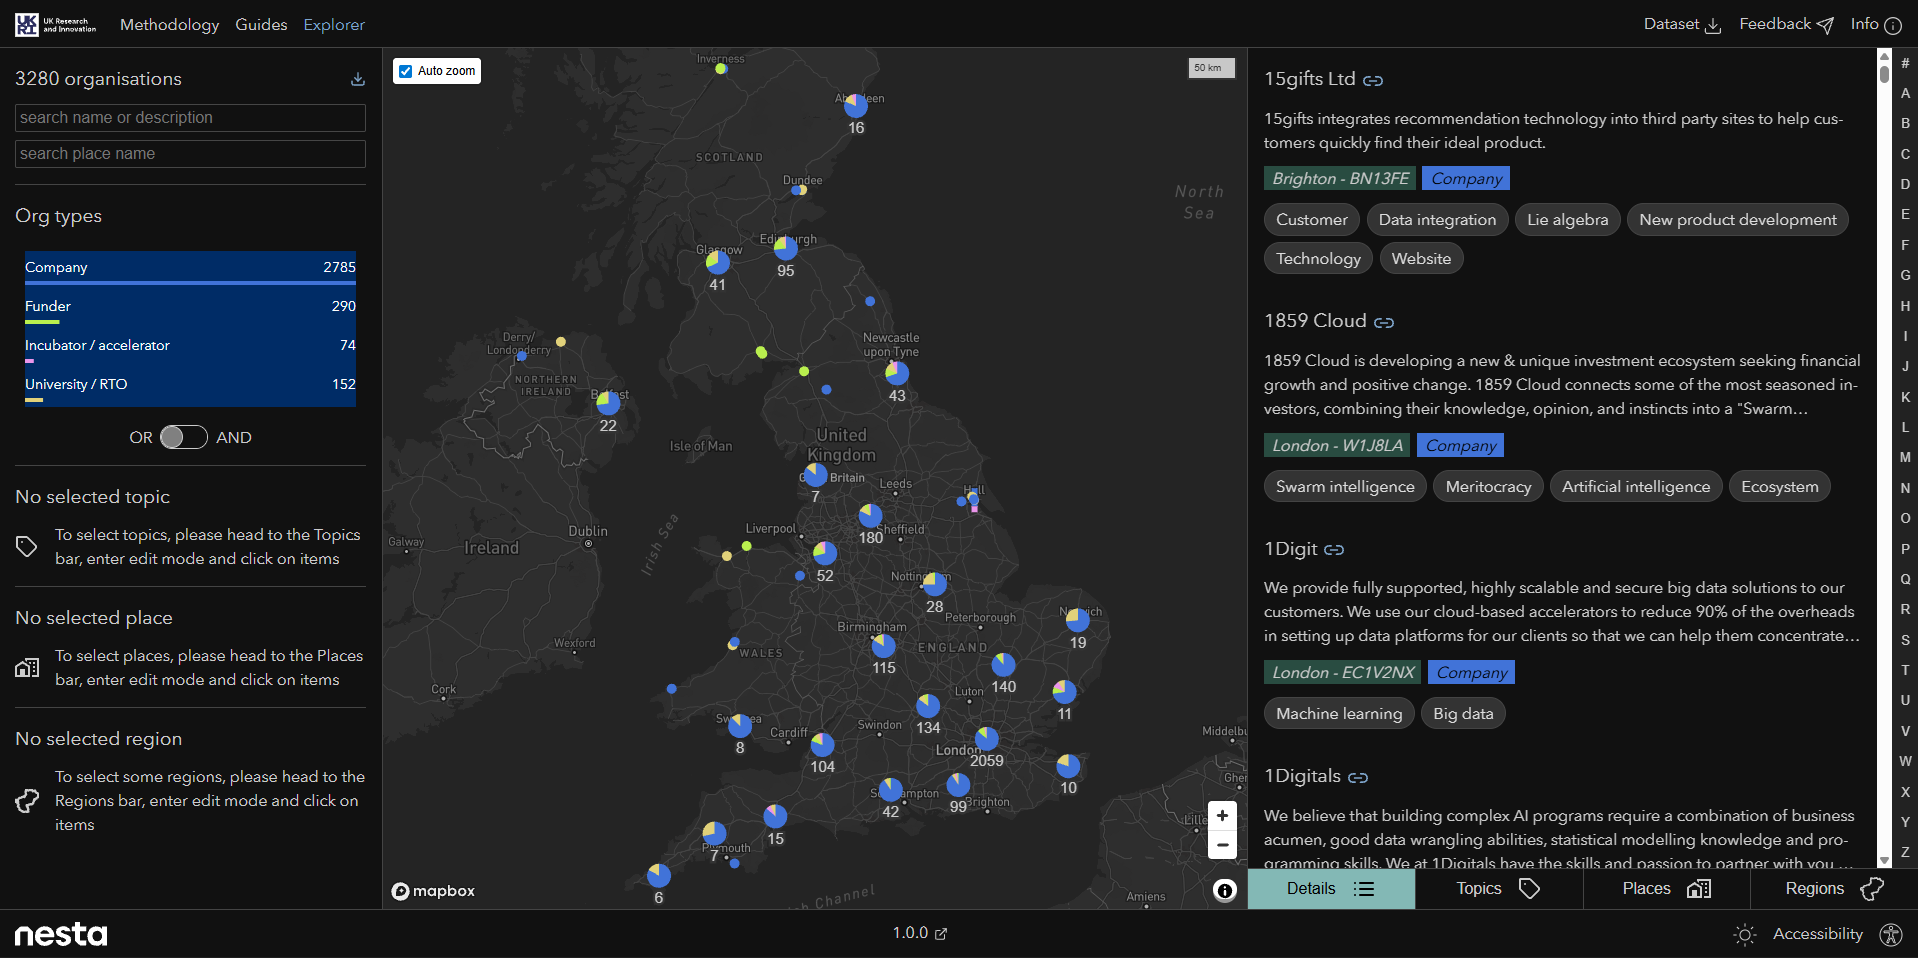
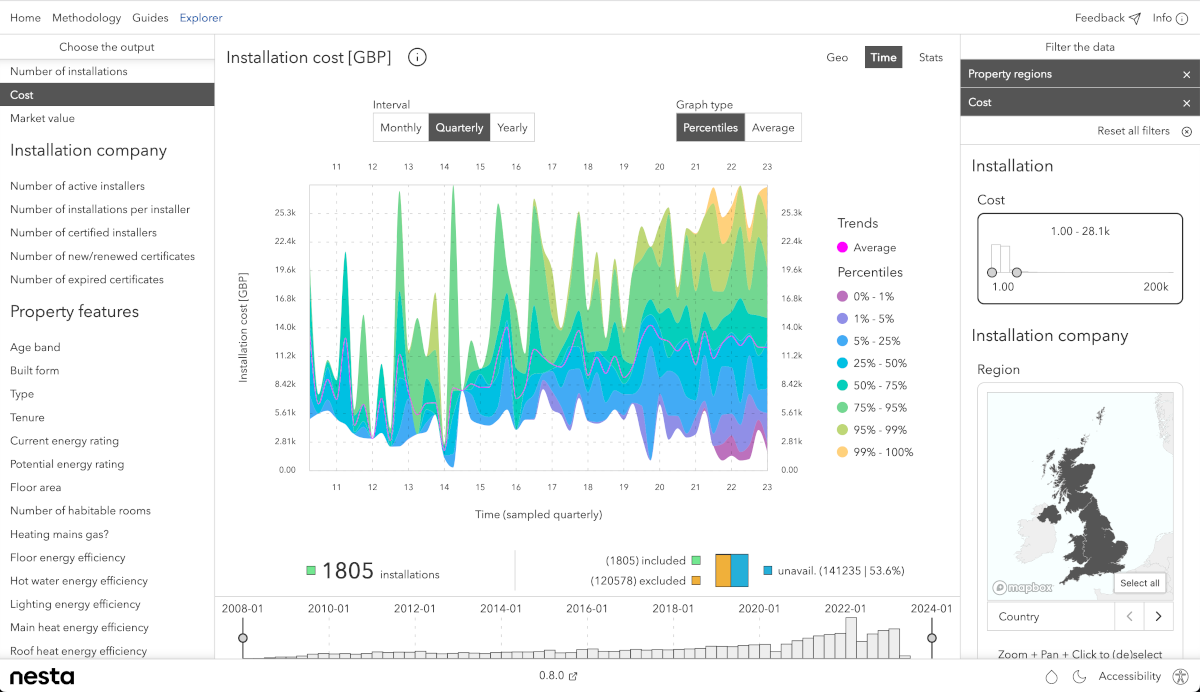
Open-source geographic dashboard for UK heat pump installs—map–chart cross-linking, filters, a11y, backend pipelines.
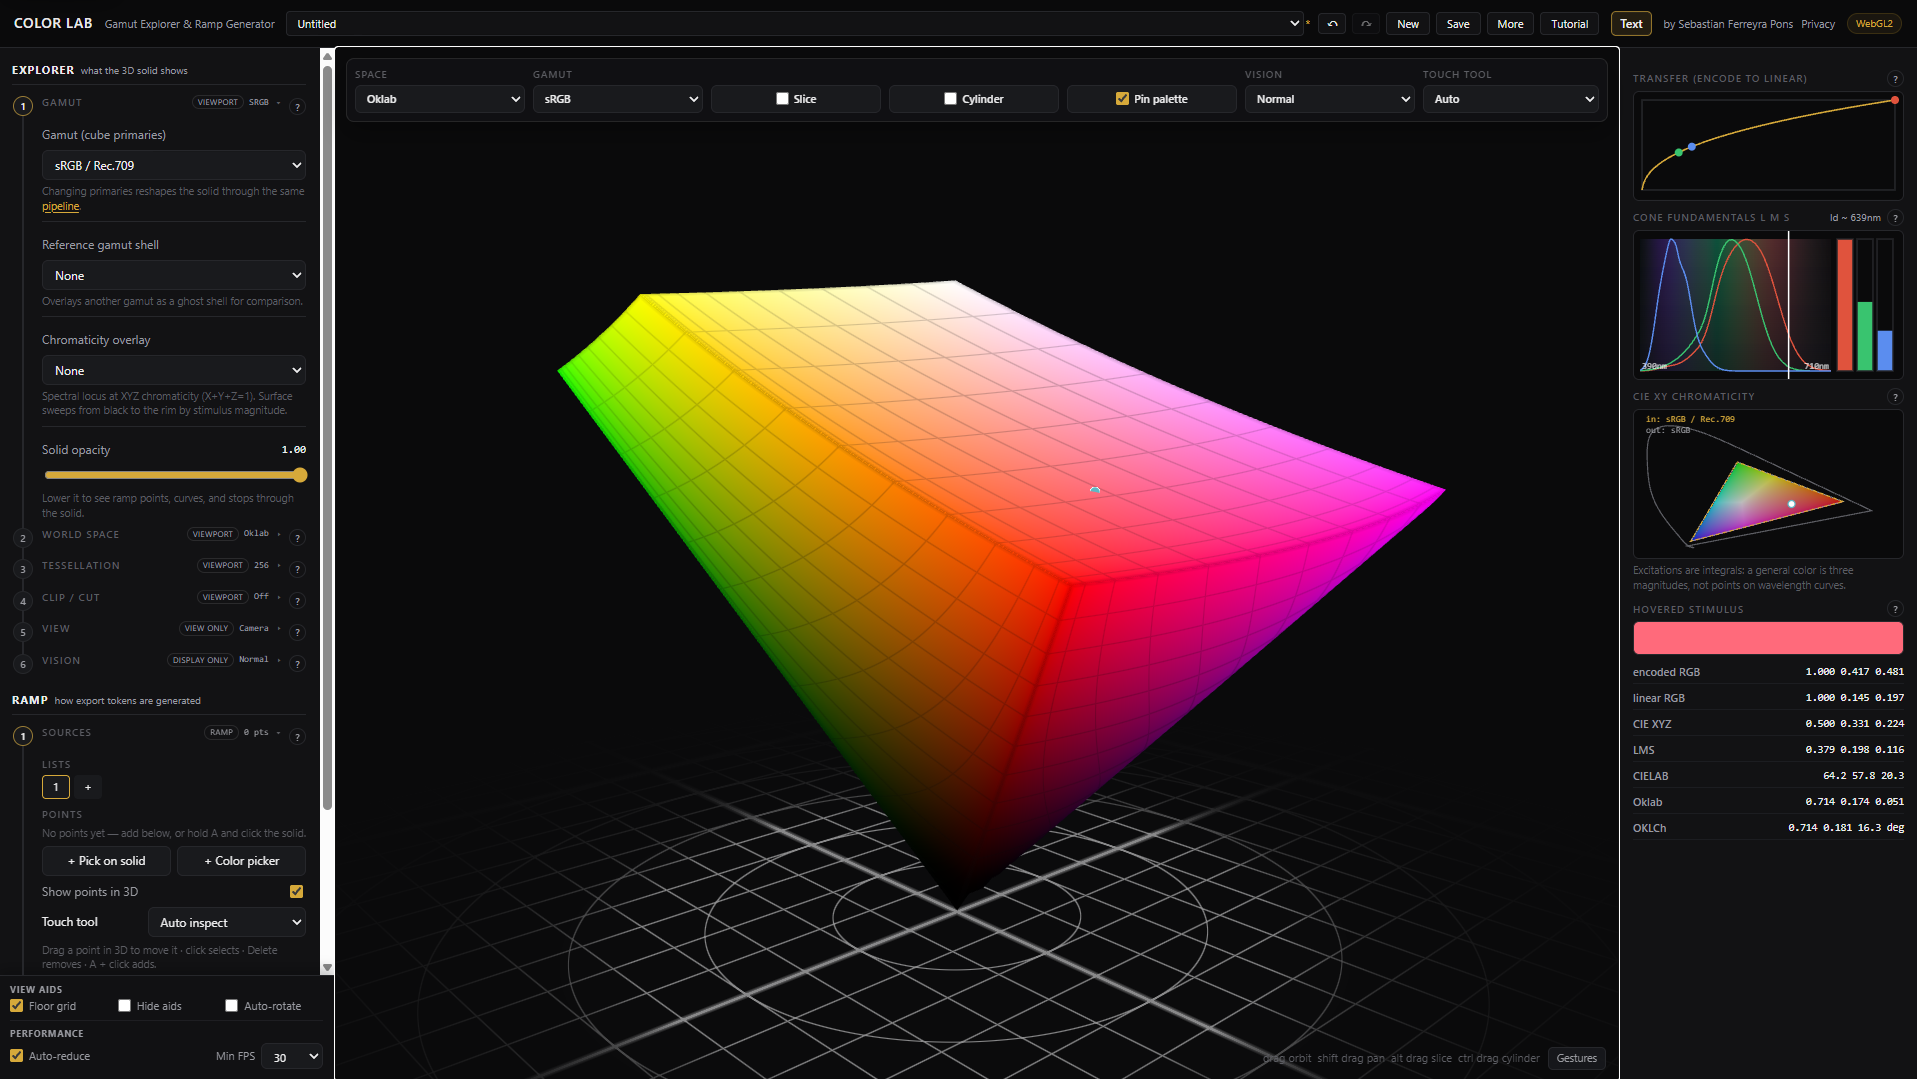
MIT open-source live public beta: WebGL2 gamut solids, observer-aware colorimetry, per-list ramp pipelines, and shareable documents.
Capabilities
SvelteKit, TypeScript, backend services, admin systems, dashboards, and client-facing platforms built for maintainability.
Accessible, high-density interfaces for charts, maps, filters, metrics, and exploratory analysis.
Map-driven products, spatial dashboards, public-sector tooling, and location-aware UX.
Practical integration of Python services, ML workflows, automation, experimental engineering tools, and browser-native domain-heavy UIs (e.g. computational 3D or analysis loops).
Align on goals, constraints, and evidence of success before committing to a stack or schedule.
Choose patterns, boundaries, and milestones that stay shippable—no surprise “big bang” reveal.
Incremental releases with review, automation, and documentation that survives handoff.
Operational basics—monitoring hooks, runbooks, and support scope—are part of done.
Most products sit between a browser surface, a data layer, and services that do the slow or specialized work. The diagram is schematic: your deployment will differ; the discipline does not.
Case studies show how these layers showed up on real projects. Typical tooling on the stack page.
Examples of how a first milestone is often bounded. Detail and deliverables stay on Capabilities.
Two to three weeks: discovery plus a narrow vertical slice and a clear go/no-go for the full build.
Two weeks: synced filters, one representative layer stack, and a short operator checklist for data prep and deployment.
One to two weeks: one model-backed flow with failure semantics, logging, and human-in-the-loop guardrails.
Send the current state, the desired state, and the first milestone you need. Replies include clarifying questions, a rough sense of fit, and a proposed first milestone.