Nesta-related data platforms
Embedded engineering on Nesta ecosystem open tools: Svizzle Svelte viz library (including Mapbox-in-Svelte), WAIfinder UK AI map with Innovate UK, Dapsboard, EURITO indicators, Heat Pump Market Tracker (geographic dashboard, chart–map cross-linking, a11y, backend pipelines), and annotation backends—map-first geospatial UX, layers, and filters alongside accessible dashboards.
7 programme projects · 1,100+ main-line attributions · Svelte/SvelteKit · Mapbox · ElasticSearch · AWS/nginx
Overview
Infomerx supplied embedded software engineering across several open-source programmes in the Nesta data-and-innovation ecosystem. Map-first UX—declarative layers, filters, clustering, and map–list coherence—was central to that work (especially on WAIfinder), not a side track.
Technical notes
Front ends are predominantly Svelte / SvelteKit with Svizzle packages; backends include Node.js, ElasticSearch, AWS (e.g. SES, CloudFormation-style deploy scripts), Fastify / Express, and nginx. Commit details are available in the public repositories. This page stays at programme and architecture level.
WAIfinder
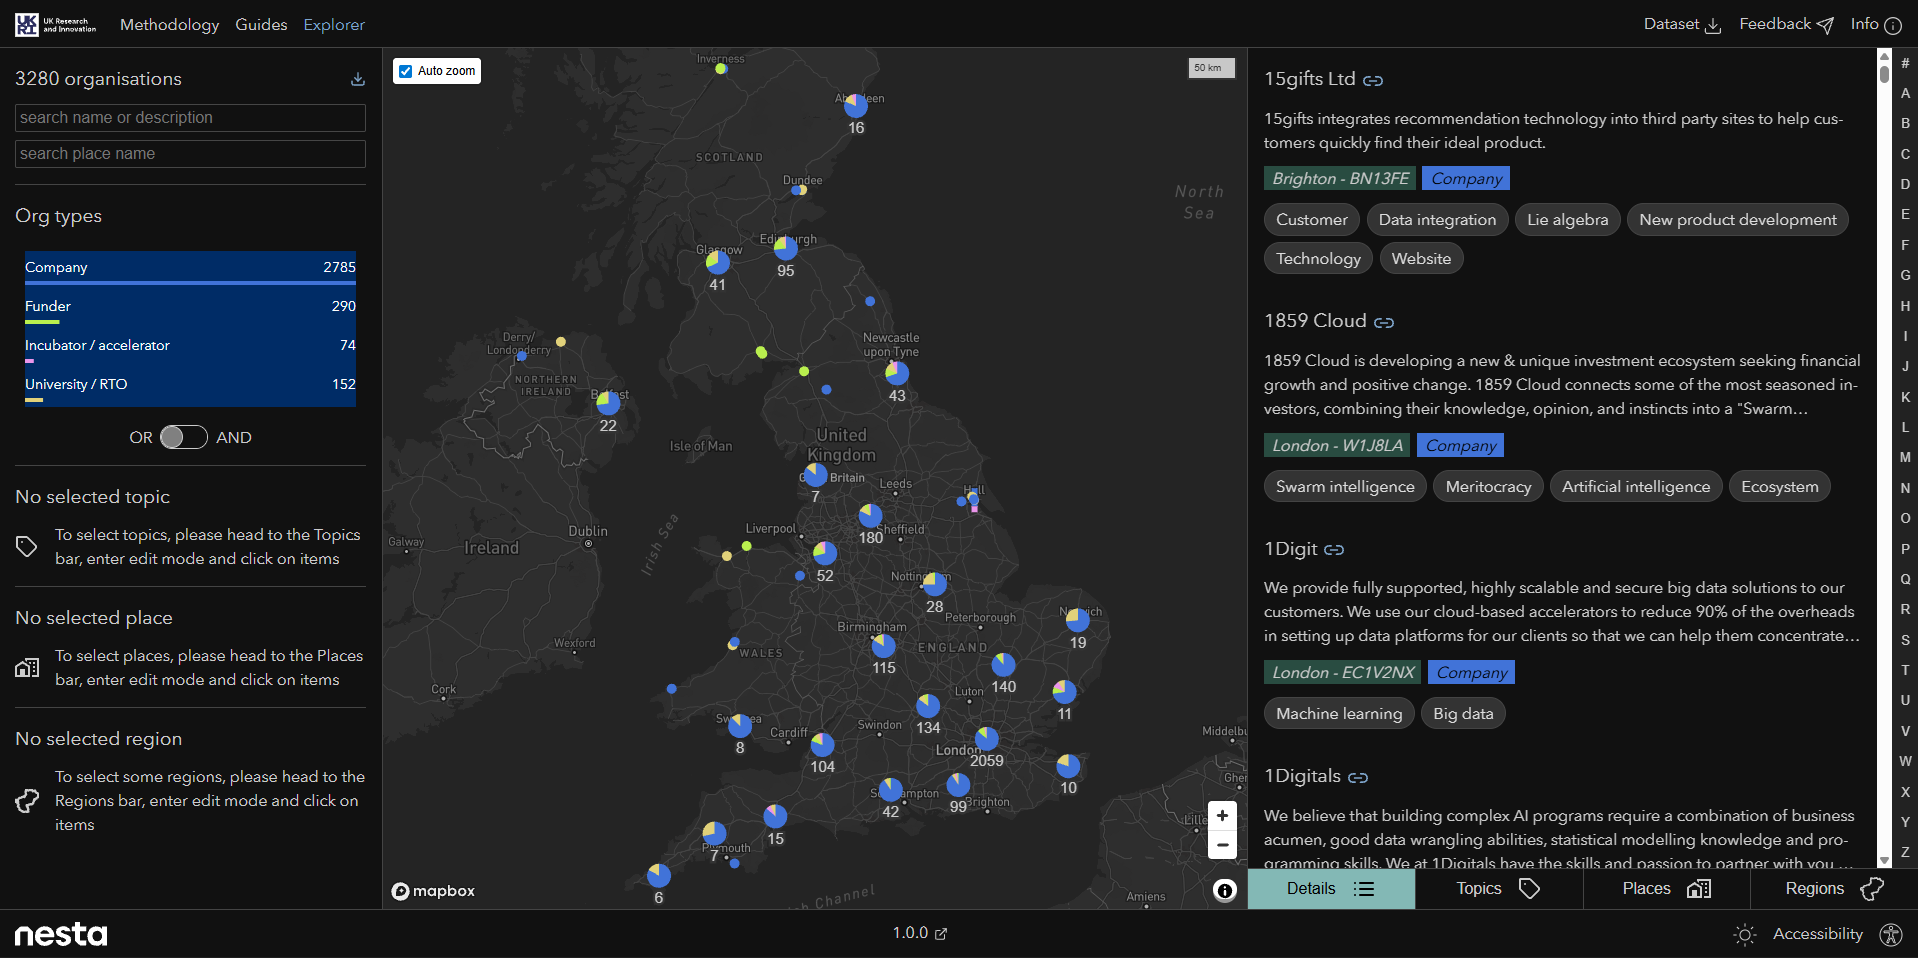
Desktop
Mobile
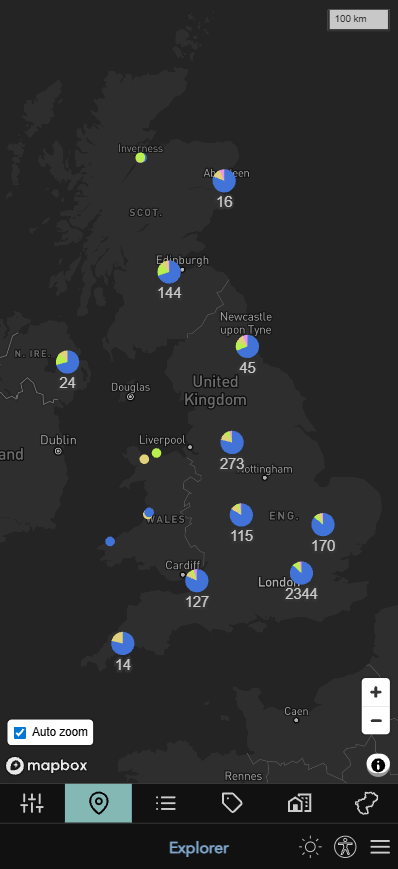
Nesta and Innovate UK collaboration: UK AI ecosystem
explorer built on @svizzle/mapbox — Supercluster clustering with expansion-zoom on click; auto-zoom that disables on manual pan and re-enables
to clear bbox area filter; OR / AND org-type filter toggle (supporting multi-category orgs);
org pinning (hover = ephemeral preview, click = persistent detail panel);
org–place–topic–region views and partner branding integration.
Svizzle
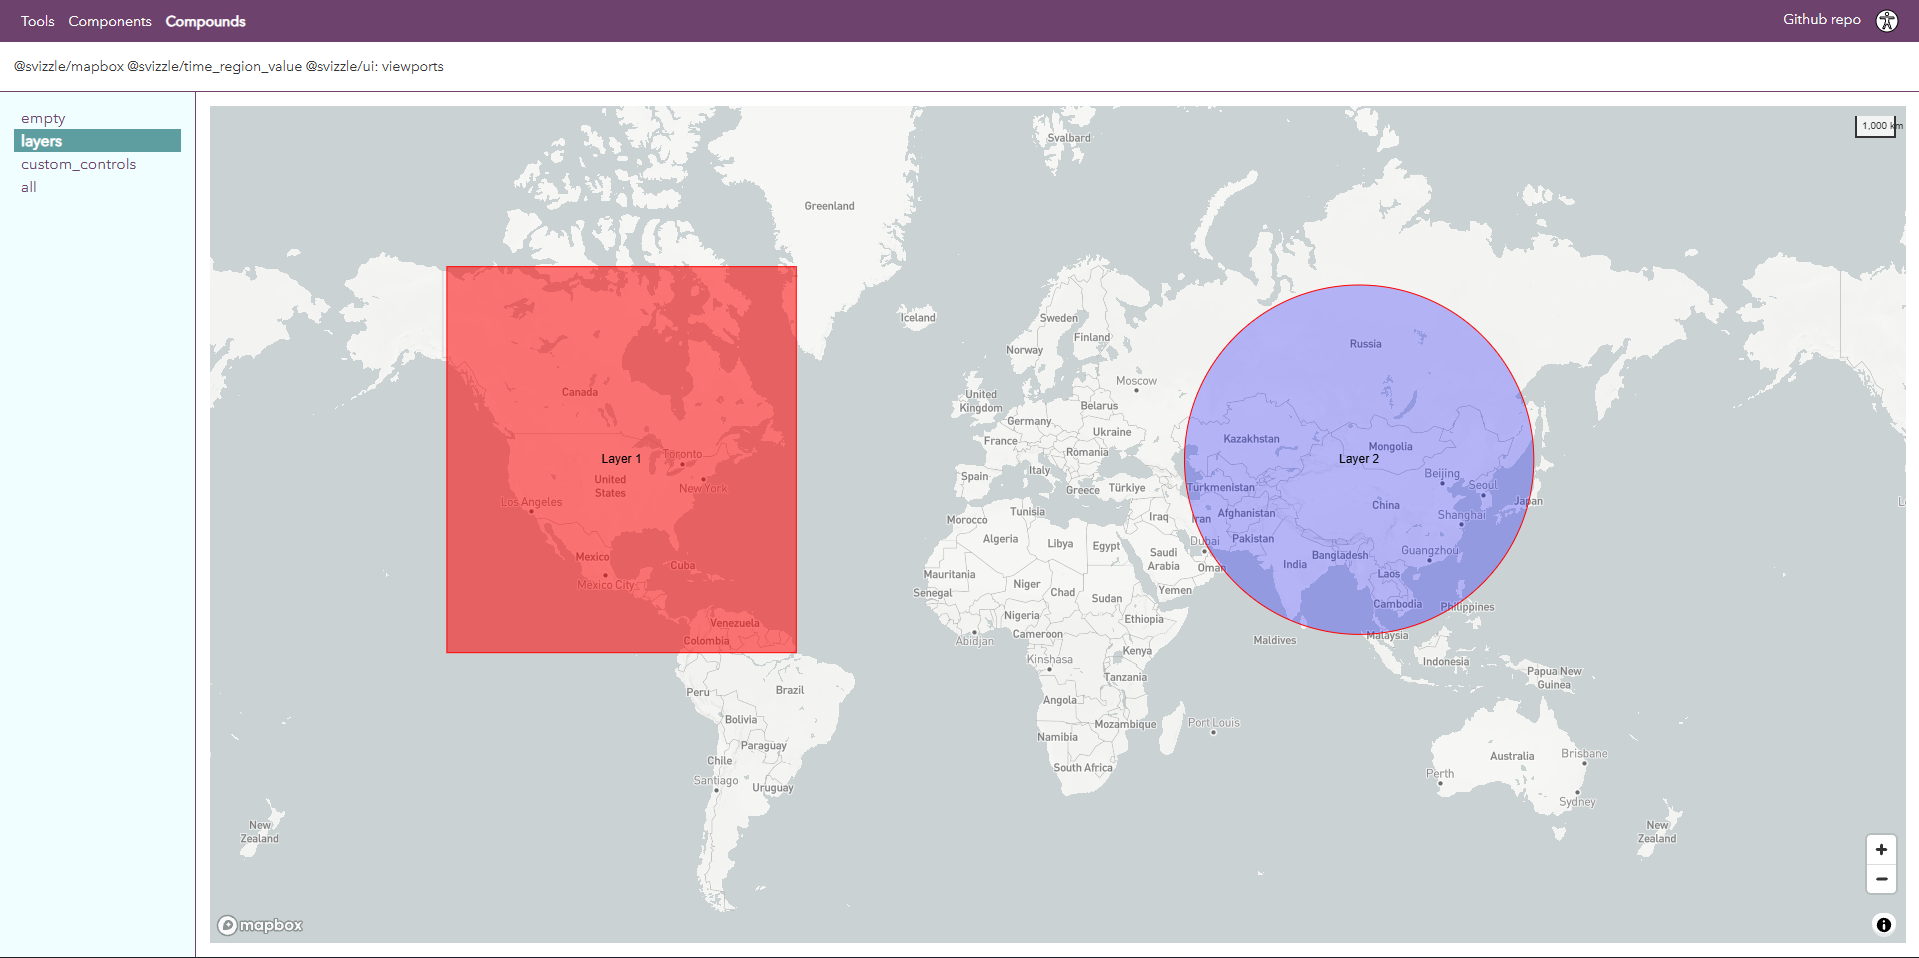
Open-source Svelte data-visualisation toolkit published under nestauk and developed in parallel with programme use — consumed by WAIfinder,
EURITO indicators, and Heat Pump Market Tracker. Contributions include: @svizzle/mapbox (Mapbox behind Svelte components — declarative
map layers and map UI widgets, used heavily in WAIfinder); ScreenSensor (measures a rendered text sample via ResizeObserver to derive glyph width/height, then expresses layout breakpoints in
character-count rather than pixels — so charts and panels adapt to the active font, not a fixed
pixel assumption); A11yMenu (in-page accessibility panel: font
family + scale, line height, letter/word spacing, contrast, brightness, hue rotation,
grayscale, and CVD simulation for protanopia / deuteranopia / tritanopia — all persisted in localStorage); plus charts, histogram, choropleth, legend, UI primitives, and
package documentation.
Heat Pump Market Tracker
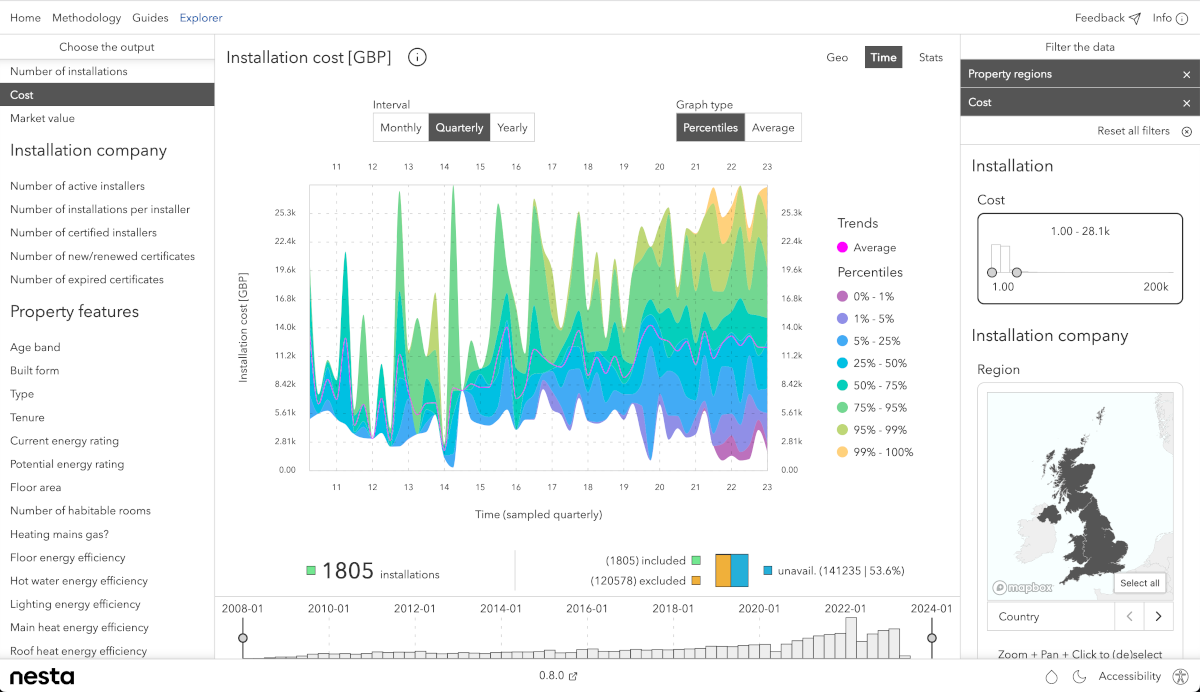
Nesta ASF programme: geographic dashboard tracking UK heat pump
installations. Features include map–chart cross-linking (bar hover highlights
the map region and vice versa), filter and metric navigation, Svizzle's ScreenSensor + A11yMenu integrated with custom font families, pa11y
/ Lighthouse audits, and backend query-shape adapters plus a dev/staging →
production data pipeline.
Dapsboard
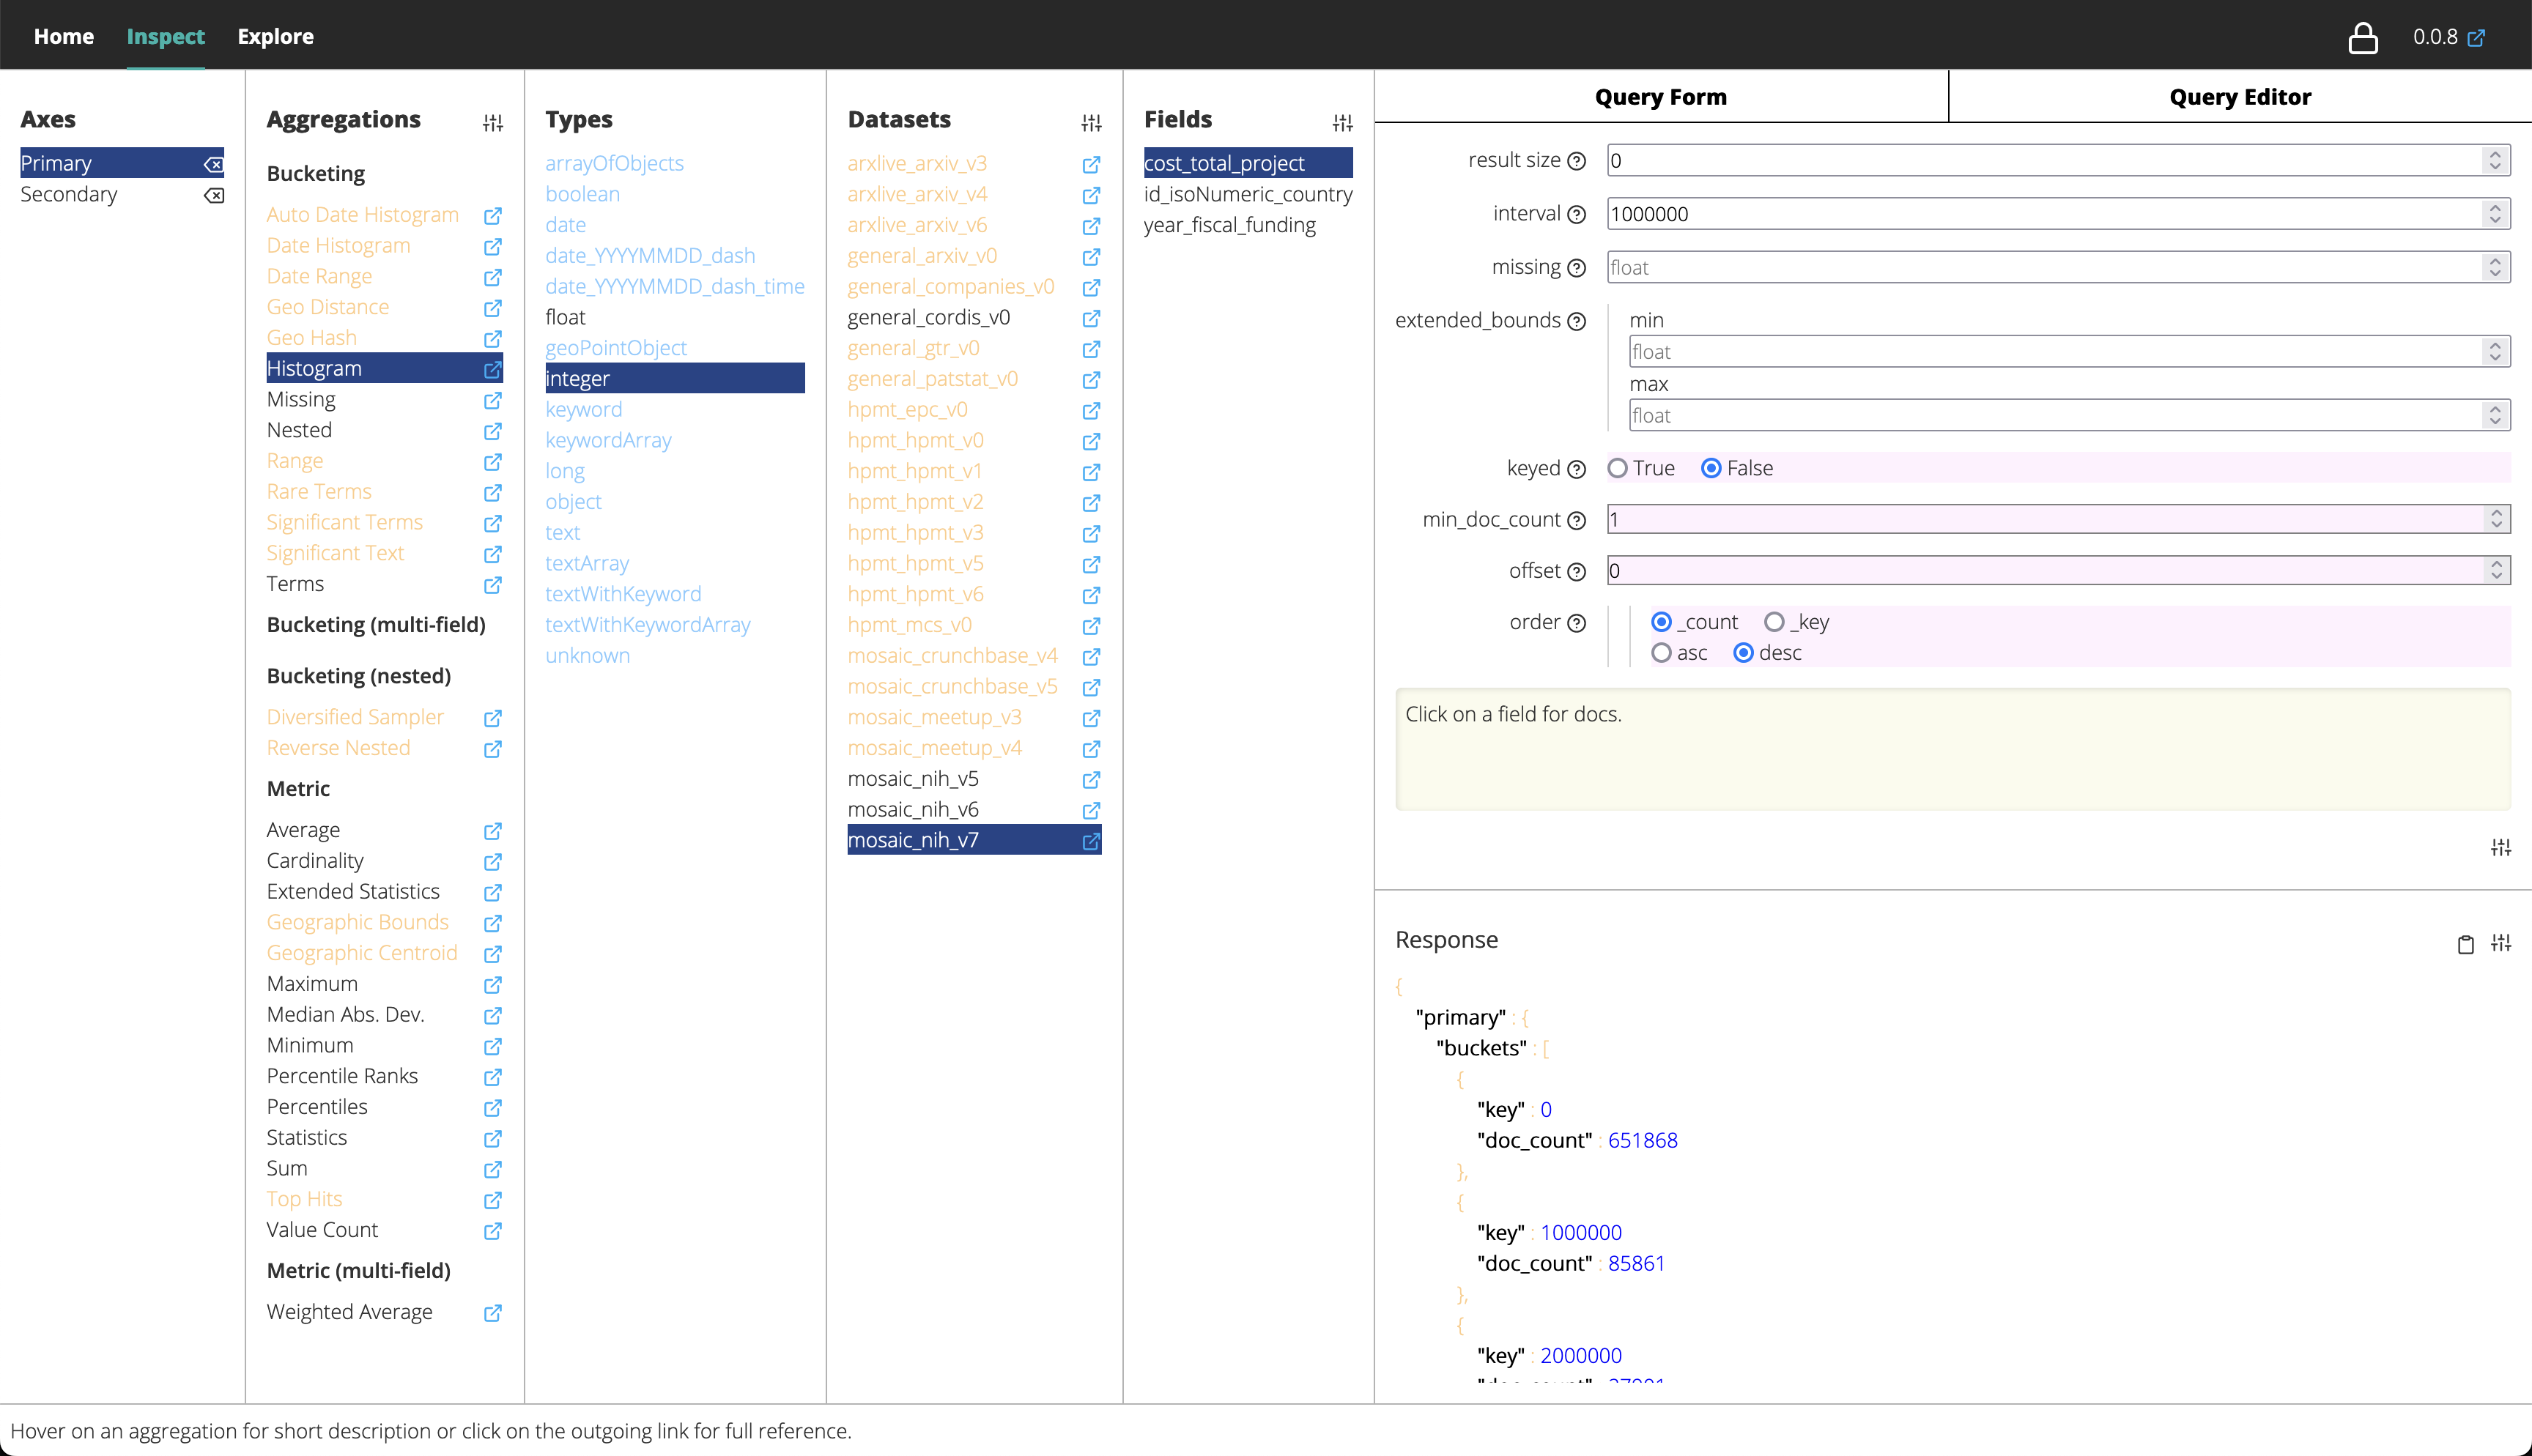
DAPS data exploration and query builder. Builder route: a custom runtime type system (xorOf, enumsOf, arrayOf, objectOf, optional, …) describes every ES aggregation's parameter schema; TypedField dispatches each type descriptor to the correct Svelte widget
(BooleanRadios, RadioList, ArrayEditor, ObjectEditor, SimpleField) so forms generate entirely from the
aggregation × field-type selection — no hand-authored form per aggregation. Explore route: XState parallel machine (History / Selecting / Results / Search); neededFields exists-query wiring; Fastify proxy to DAPS
ElasticSearch with MongoDB hash-based response cache; coverage queries;
dataset specs; and end-to-end authentication (Basic Auth via dap-tools.uk,
CORS-gated unauthenticated access, protected datasets, HTTP 401 client handling).
EURITO indicators
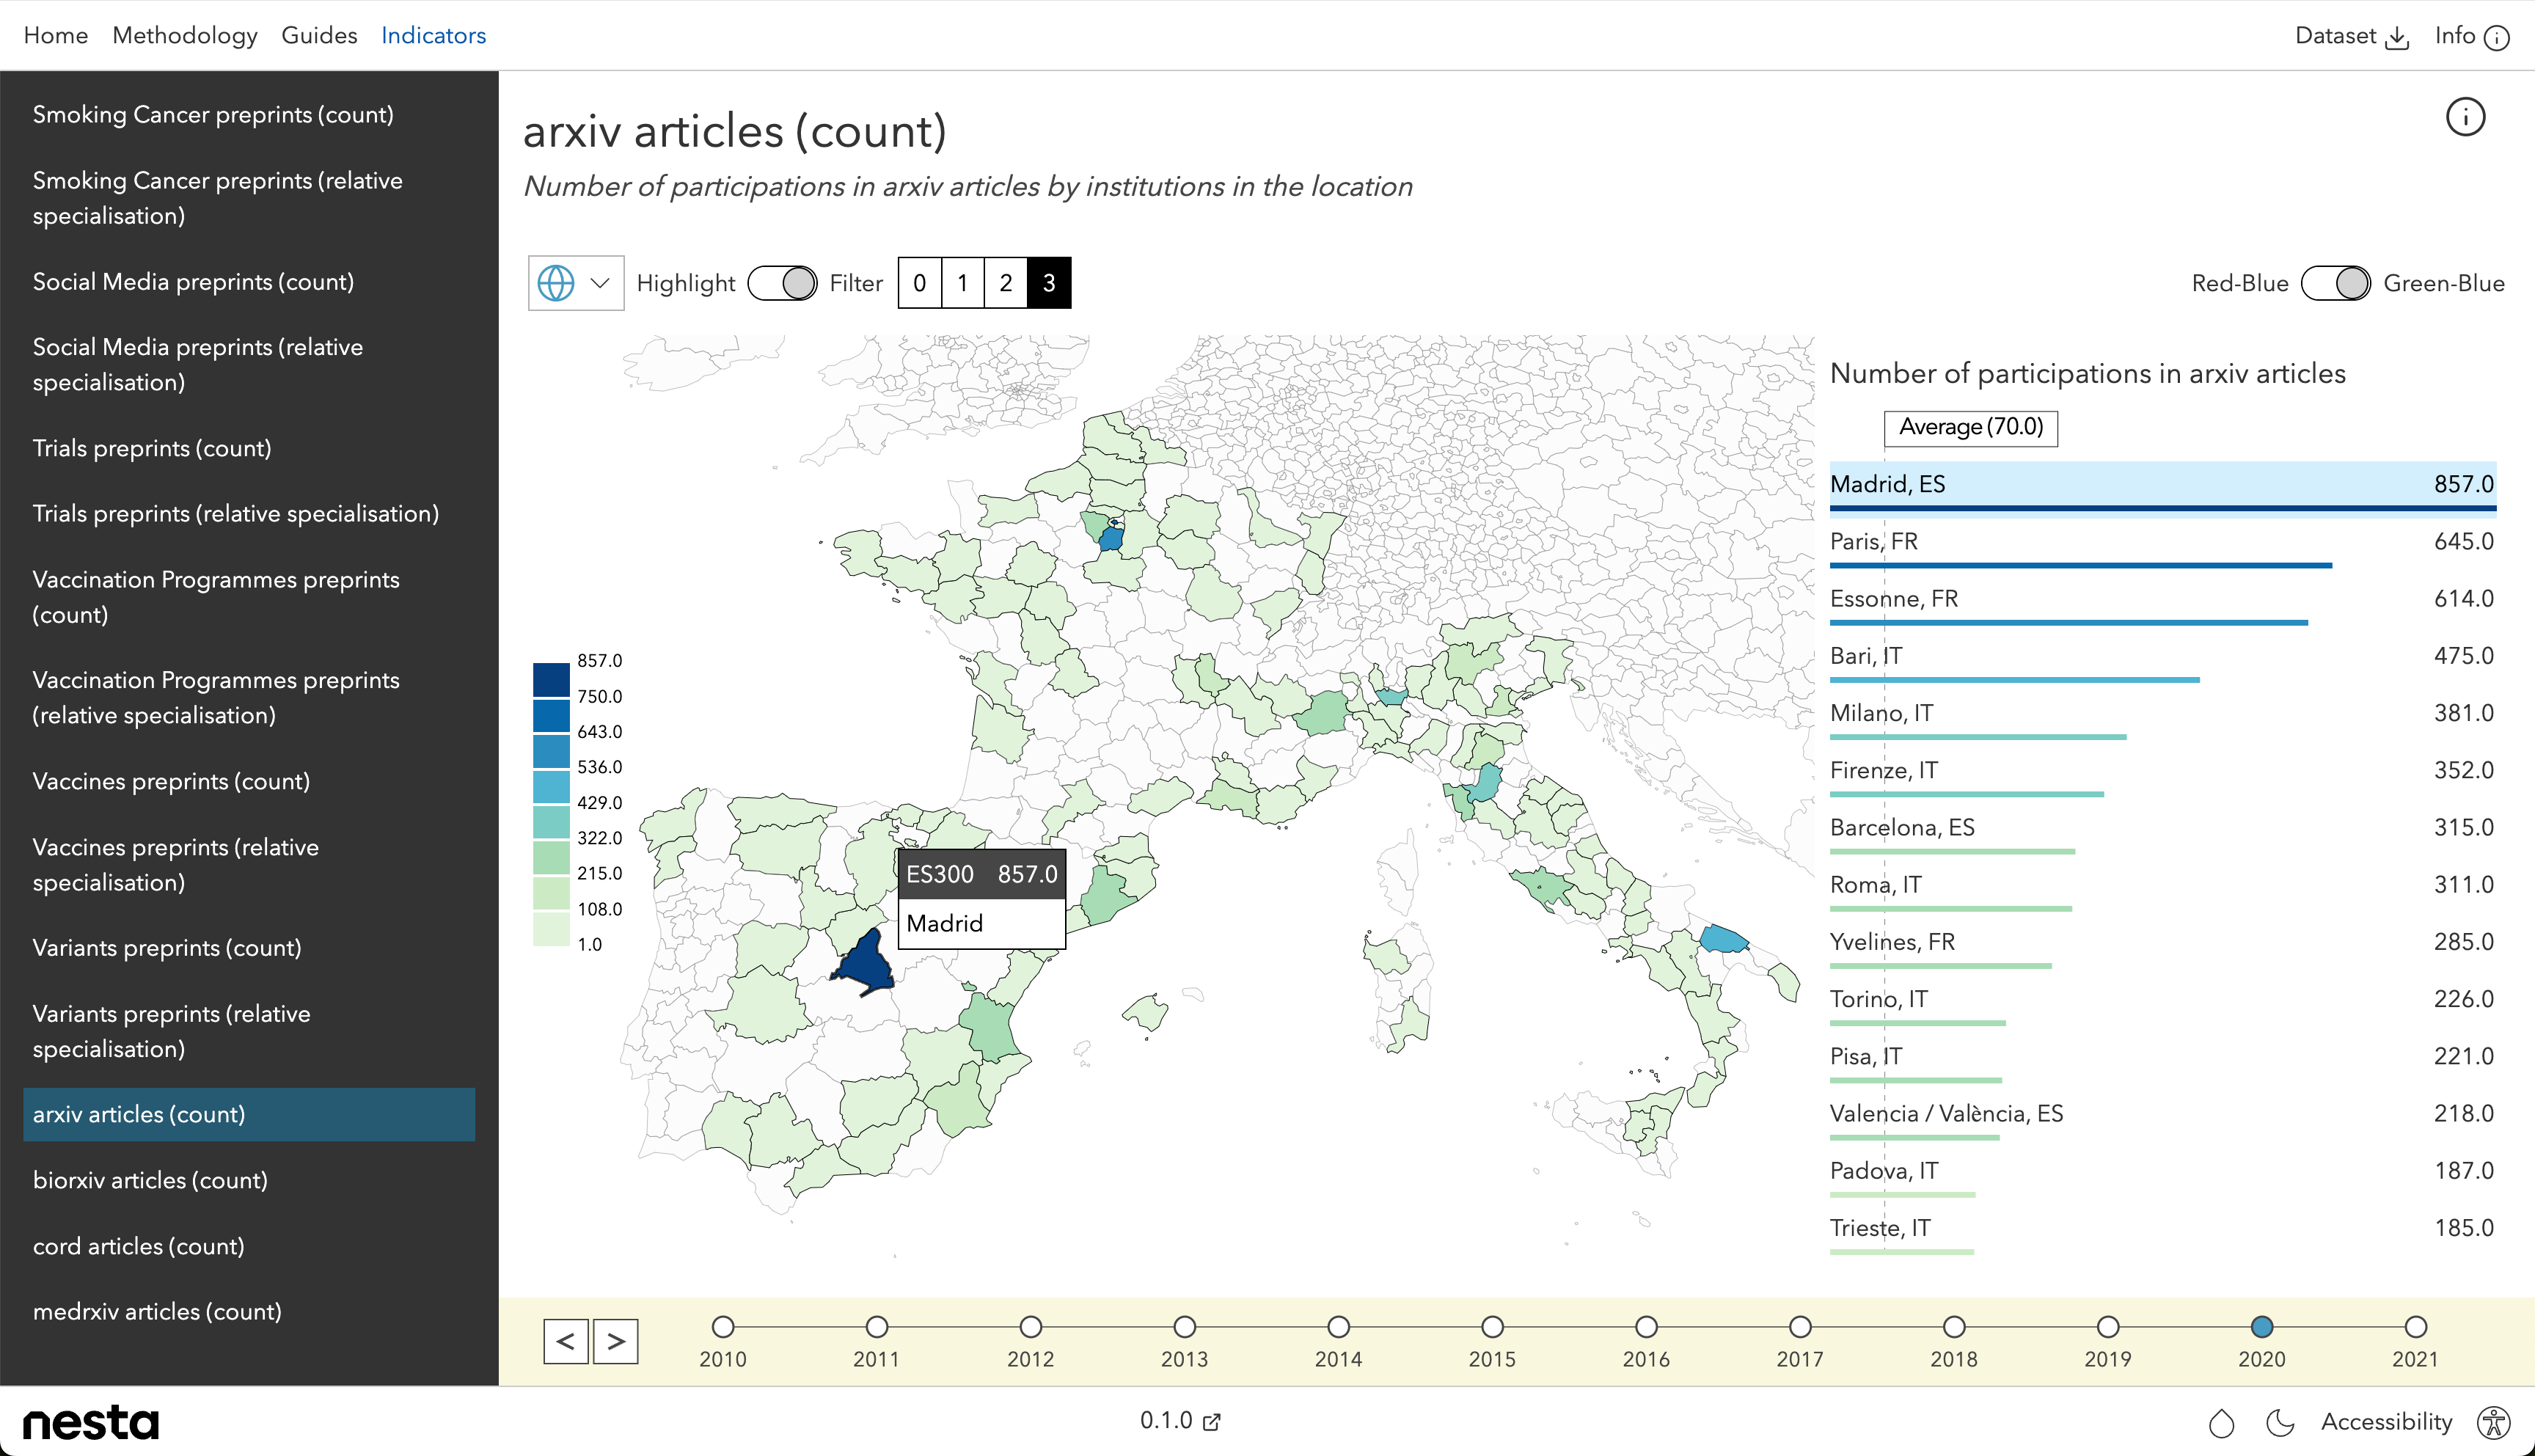
Application modernisation (Sapper to SvelteKit); the app is a thin configuration wrapper over time_region_value Svizzle routes — NUTS2 choropleth and
time-series indicator views consumed wholesale as packages, demonstrating Svizzle's
completeness as a reusable programme toolkit; guide routes and quality-tooling hooks.
Annotation / infrastructure
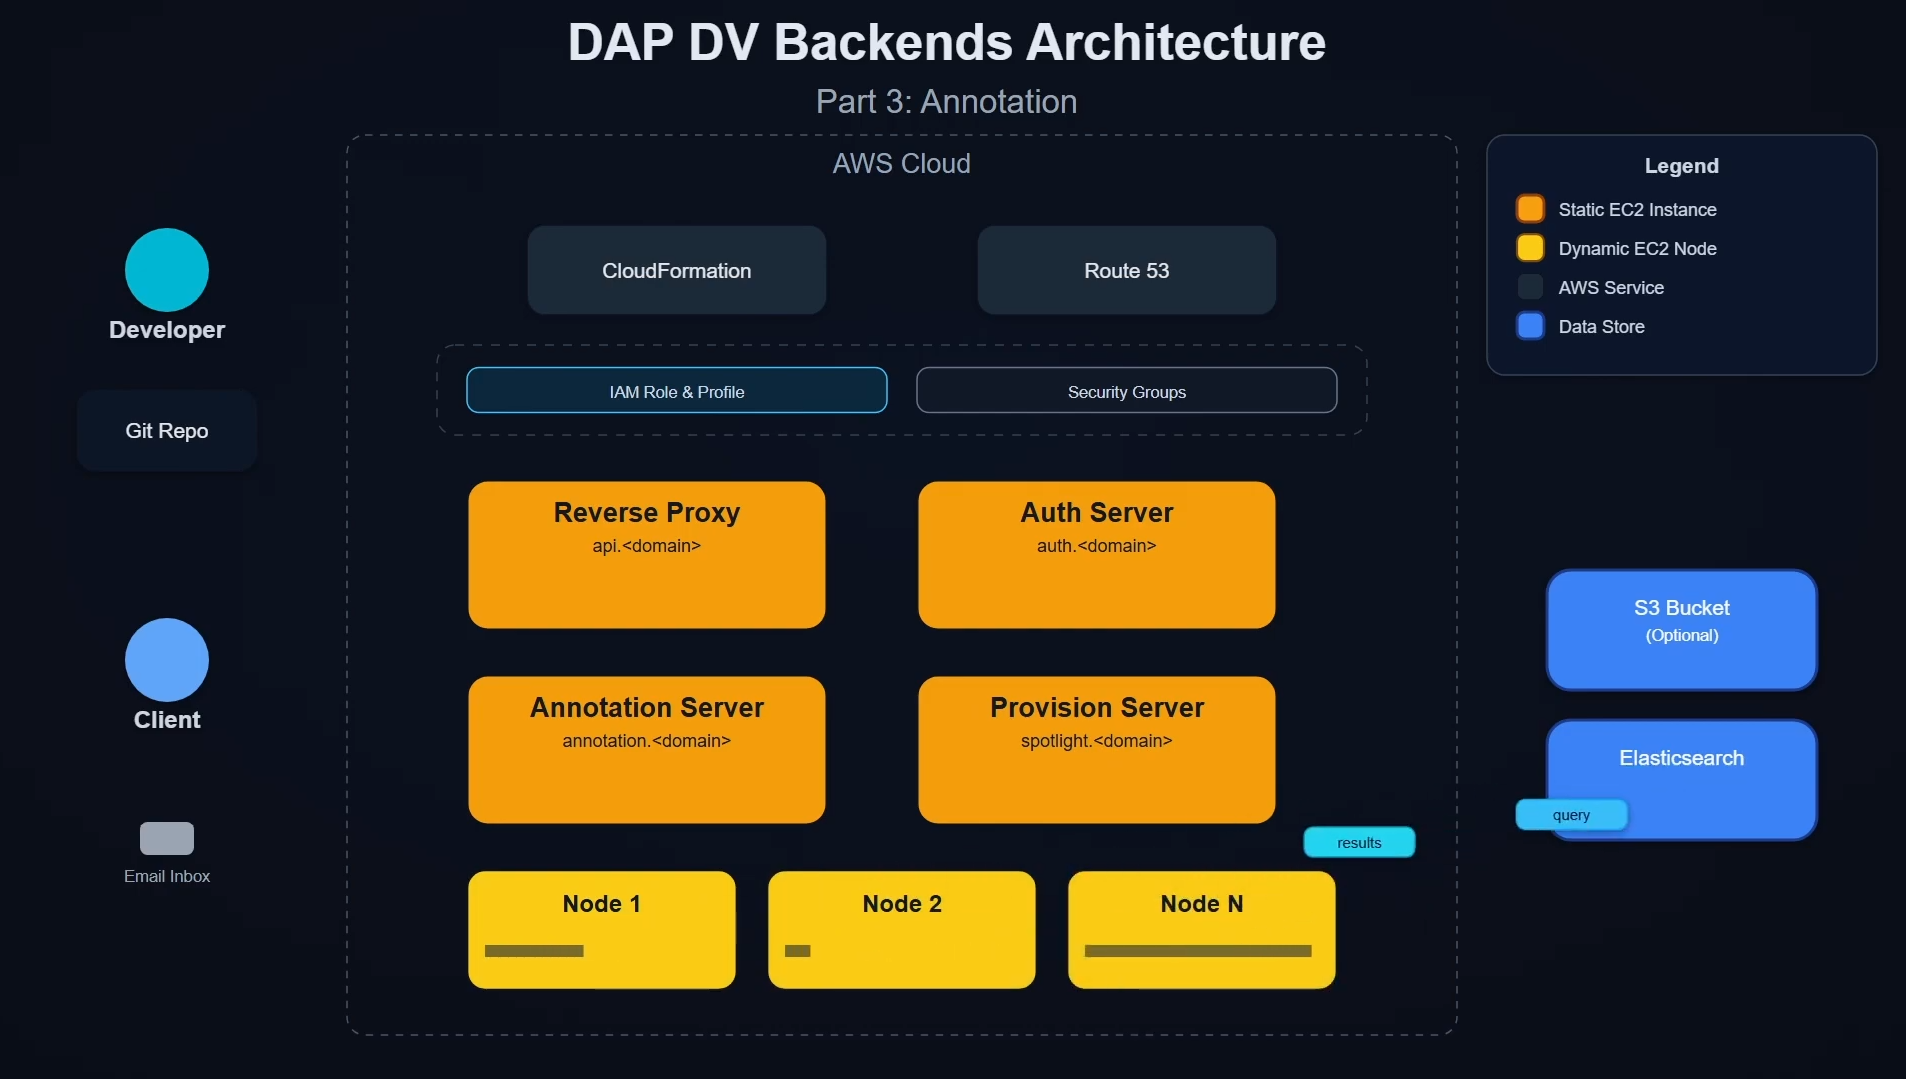
Two-tier AWS system. Base layer: an interactive CloudFormation deploy script (validates R53 hosted zone, S3 cert, AMI;
prompts config; polls stack events to CREATE_COMPLETE; confirms service
readiness) that provisions four EC2 instances — API gateway, authentication, provision, and
annotation coordinator — each with Route 53 DNS records derived from their
public IPs and Certbot HTTPS. Scaling layer: the provision server exposes a
REST API (/create, /teardown, /status) — POST /create { workers: N } generates a Terraform config with N annotation-node-* EC2 instances, runs terraform apply, reads public
IPs from Terraform state, regenerates the nginx upstream block to
load-balance across them, reloads nginx, and SSH-launches the DBpedia Spotlight Docker container on each new node. dap_dv_backends_utils provides the Terraform command wrappers and state reader
imported by this service, as well as the NER annotation pipeline (ES scroll → batch →
Spotlight → bulk update), SigV4-signed ES requests, S3↔ES sync, auth, and SES utilities —
also consumed by Dapsboard.
Attribution and repositories
Framing here is factual only and does not imply endorsement by Nesta or its partners. Upstream code and docs live under the nestauk GitHub organization; Infomerx does not own those repositories — links above are for transparency only.
Technical notes
Infomerx-attributed history across the seven principal nestauk programme projects is on the order of 1,100+ unique commits on main in audited clones. Upstream delivery typically squash-merges or rebases reviewed PRs, so each recorded commit often bundles many smaller revisions—roughly one integration per merged PR, not a single editing session. Treat the count as a scale indicator; full attribution detail lives in the public repositories.
Challenge
Policy and research audiences need maps, indicators, and dashboards that stay legible under real metric density: coherent map–list behaviour, progressive disclosure instead of "chart soup," and reusable building blocks so each new tool does not reinvent visualization, auth, and deployment patterns.
Technical notes
Cross-cutting UX patterns include Supercluster-based clustering with auto-zoom / manual map control hand-off (WAIfinder), and XState parallel explore machines (Dapsboard) that keep query state, search, and results in sync without ad-hoc imperative wiring.
Approach
Infomerx worked inside existing programme repos: ship vertical slices in the product repositories, land shared abstractions in the library where they belong, and keep operator-facing docs and scripts honest so pipelines stay deployable — not only demo-ready.
Technical notes
Conventional commits, peer review in the upstream workflow, and cross-repo semver discipline
on @svizzle/* packages (local npm link flows where apps trailed published
releases) were part of day-to-day delivery.
Outcomes
Outcomes are best read as capability and maintainability: reusable visualization and map primitives, production-shaped auth and explore flows, and pipelines that other researchers and engineers could extend without a ground-up rewrite. Any quantitative programme metrics stay with the programme owners and contracts — not reproduced here.